Google Earth Engine (GEE)
While built on JavaScript, Google Earth Engine implements functional programming, a computing paradigm that allows for processing and loading big data quickly. Several common features of conventional programming, such as iteration and comparison, are strongly discouraged in functional programming.
Loading MODIS Image Collections & Graphing
/********************************** LOAD MODIS AQUA AND TERRA DATA ***********************************/
var collectionAqua = ee.ImageCollection("MODIS/006/MYD11A2")
  .filterDate('2020-06-01', '2020-06-20')
  .sort('system:time_start');                         //sort images by date captured


var collectionTerra = ee.ImageCollection("MODIS/006/MOD11A1")
  .filterDate('2020-06-01', '2020-06-11')
  .filter(ee.Filter.calendarRange(6, 8, 'month')) //restrict to images in summer months
  .sort('system:time_start');                         //sort images by date captured

//This function clips images to NYC
var clip = function(image) {
  return image.clip(BoroughBoundaries);
};
collectionTerra = collectionTerra.map(clip);  //map the clipping function over the image collection
collectionAqua = collectionAqua.map(clip);  //map the clipping function over the image collection

//print the number of images in the collection
var countTerra = collectionTerra.size();
var countAqua = collectionAqua.size();

print('Number of Images in the Aqua Image Collection:', countAqua);
print('Number of Images in the Terra Image Collection:', countTerra);
/***************************** RENAME BAND *****************************/

var changeBandName = function(image) {
  var LST1km = image.select('LST_Day_1km').multiply(.02).subtract(273.15);
  var LST = LST1km.rename('LST');
  return image.addBands(LST);
};

collectionAqua = collectionAqua.map(changeBandName);
collectionTerra = collectionTerra.map(changeBandName);
/*********************************** DISPLAY LST MAP ************************************/
//ADDS LST MAP LAYER

//color palette for LST map visualization
var LSTpalette = ['blue', 'cornflowerblue', 'aqua', 'greenyellow',
                  'yellow', 'gold', 'orange', 'red'];

//Visualization Parameters for Map
var TsVisParams = {
    min: 20, max: 50,    //use with C
  //min: 80, max: 100,   // use with F
  palette: LSTpalette};

//Adds first image layer to map, do not display
Map.addLayer(collectionTerra.first().select('LST'), TsVisParams, 'Terra LST', 0);
Map.addLayer(collectionAqua.first().select('LST'), TsVisParams, 'Aqua LST', 0);

//print date of image displayed to console
var date = collectionAqua.first().get('system:time_start');
print('Date of Aqua Map Displayed:', ee.Date(date));

var date = collectionTerra.first().get('system:time_start');
print('Date of Terra Map Displayed:', ee.Date(date));

//Image of mean LST calculated over the image collection
var mean_Aqua_LST = collectionAqua.mean().select('LST');
var mean_Terra_LST = collectionTerra.mean().select('LST');

//Apply correct visualization parameters to mean LST Image
var mean_Aqua_image = mean_Aqua_LST.visualize(TsVisParams); // create the mean image
var mean_Terra_image = mean_Terra_LST.visualize(TsVisParams); // create the mean image

//Displays the average LST for each pixel over all the images on Map
Map.addLayer(mean_Aqua_image, {}, 'Mean Aqua LST');
Map.addLayer(mean_Terra_image, {}, 'Mean Terra LST');
/*********************************** CONDUCT CENSUS TRACT ANALYSIS ************************************/
// Establish each community district
var censusblocks = ee.FeatureCollection(table);
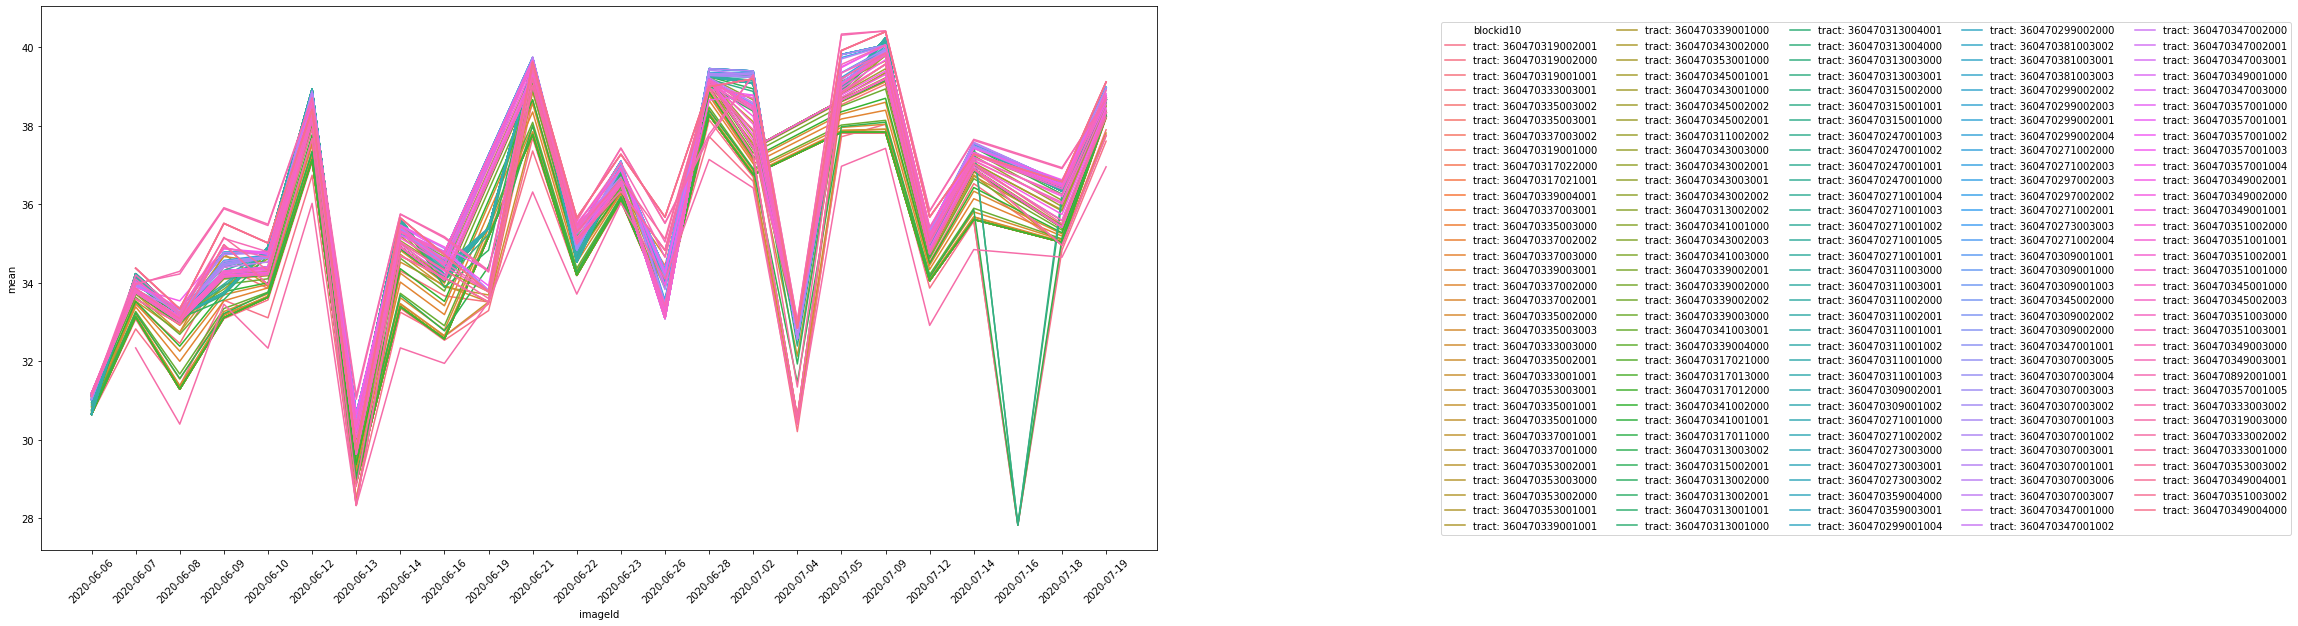
// For each community district, determine a mean LST value and graph.
print(ui.Chart.image.seriesByRegion(
collectionTerra, censusblocks, ee.Reducer.mean(), 'LST', 30,'system:time_start', 'bctcb2010')
);
print(ui.Chart.image.seriesByRegion(
collectionAqua, censusblocks, ee.Reducer.mean(), 'LST', 30,'system:time_start', 'bctcb2010')
);
Map.addLayer(censusblocks, {}, 'Census Tracts');
 The above graph is missing several data points. This is a result of Aqua and Terra’s inability to capture measurements where there is extreme cloud cover. Additionally, as a result of their low spatial resolutions, one pixel may extend over several census tracts.
Using GEE Python API to Exploit Capabilities
Google Earth Engine is distributed in many form factors, one of those being a Python library and API. Using some of its features, we can perform single operations that would have otherwise thrown memory limit errors. For instance, we can create a time series with each census tract and its respective mean LST as measured by Aqua or Terra.
Google Earth Engine Example
/********************************** LOAD MODIS AQUA DATA ***********************************/
var collectionAqua = ee.ImageCollection("MODIS/006/MYD11A2")
  .filterDate('2020-06-01', '2020-06-20')
  .sort('system:time_start');                         //sort images by date captured
var clip = function(image) {
  return image.clip(BoroughBoundaries);
};
collectionAqua = collectionAqua.map(clip);  //map the clipping function over the image collection
var changeBandName = function(image) {
  var LST1km = image.select('LST_Day_1km').multiply(.02).subtract(273.15);
  var LST = LST1km.rename('LST');
  return image.addBands(LST);
};
collectionAqua = collectionAqua.map(changeBandName);

print('Size of MODIS Aqua collection', collectionAqua.size());
/********************************** LOAD TABLE AND CREATE TRIPLETS ***********************************/
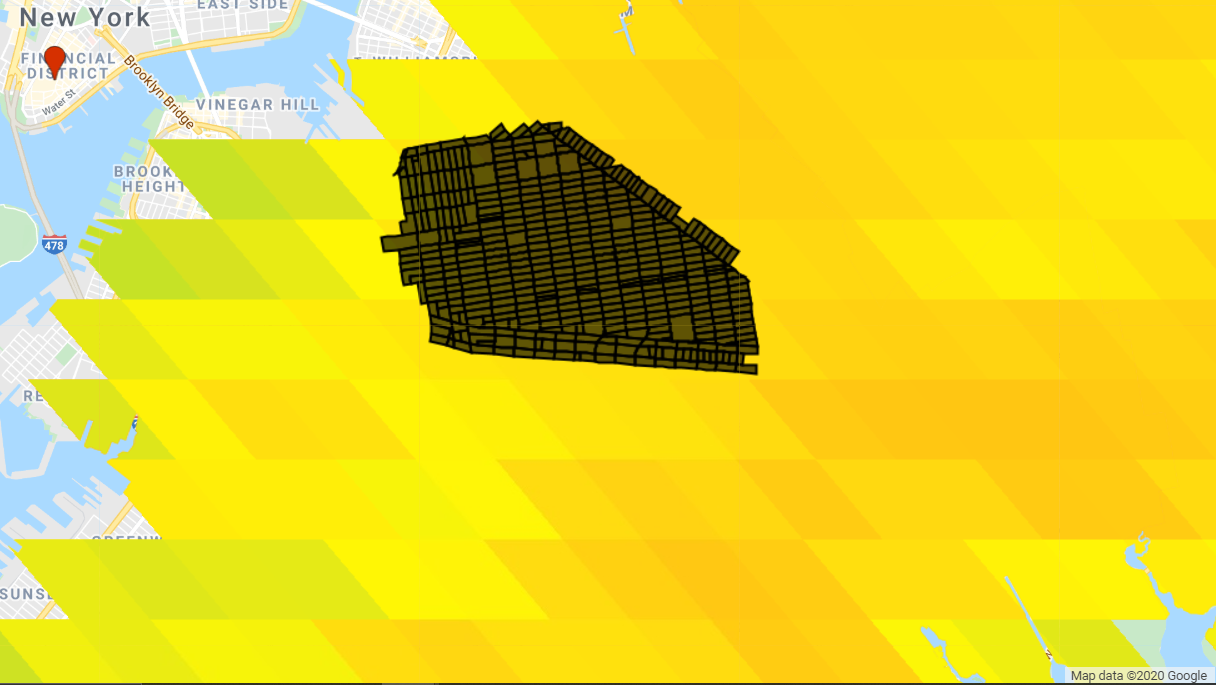
var blocks = ee.FeatureCollection('TIGER/2010/Blocks');
var subset = blocks.filterBounds(roi);
print('Size of Census blocks subset', subset.size());
Map.centerObject(roi, 13);
Map.addLayer(blocks, {color: 'gray'}, 'blocks');
Map.addLayer(subset, {}, 'subset');
// Collect block, image, value triplets.
var triplets = collectionAqua.map(function(image) {
return image.select('LST').reduceRegions({
collection: subset.select(['blockid10']),
reducer: ee.Reducer.mean(),
scale: 30
}).filter(ee.Filter.neq('mean', null))
.map(function(f) {
return f.set('imageId', image.id());
});
}).flatten();
print(triplets.first());
// Format a table of triplets into a 2D table of rowId x colId.
var format = function(table, rowId, colId) {
// Get a FeatureCollection with unique row IDs.
var rows = table.distinct(rowId);
// Join the table to the unique IDs to get a collection in which
// each feature stores a list of all features having a common row ID.
var joined = ee.Join.saveAll('matches').apply({
primary: rows,
secondary: table,
condition: ee.Filter.equals({
leftField: rowId,
rightField: rowId
})
});
return joined.map(function(row) {
// Get the list of all features with a unique row ID.
var values = ee.List(row.get('matches'))
// Map a function over the list of rows to return a list of
// column ID and value.
.map(function(feature) {
feature = ee.Feature(feature);
return [feature.get(colId), feature.get('mean')];
});
// Return the row with its ID property and properties for
// all matching columns IDs storing the output of the reducer.
// The Dictionary constructor is using a list of key, value pairs.
return row.select([rowId]).set(ee.Dictionary(values.flatten()));
});
};
/********************************** EXPORT ***********************************/
var suffix = '_downloadMulti';

var table1 = format(triplets, 'imageId', 'blockid10');

var desc1 = 'table1' + suffix;
Export.table.toDrive({
  collection: table1,
  description: desc1,
  fileNamePrefix: desc1,
  fileFormat: 'CSV'
});

var table2 = format(triplets, 'blockid10', 'imageId');

var desc2 = 'table2' + suffix;
Export.table.toDrive({
  collection: table2,
  description: desc2,
  fileNamePrefix: desc2,
  fileFormat: 'CSV'
})
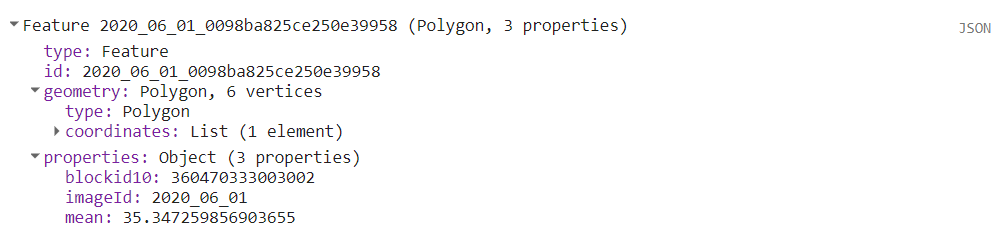 The JSON above is the data for the first census tract.
Original code from Nick Clinton
Now that we know how to extract time series from small geometries, we can scale this approach by specifying several similar geometries and concatenating the results in Python.
Package Initialization
Open a Jupyter notebook or create a Google Colab workspace (recommended).
import ee
ee.Authenticate()
ee.Initialize()
import numpy as np
import pandas as pd
from matplotlib import pyplot as plt
Triplet Function Creation
#/********************************** LOAD MODIS AQUA DATA ***********************************/
collectionAqua = ee.ImageCollection("MODIS/006/MYD11A2")\
.filterDate('2020-06-01', '2020-06-20')\
.sort('system:time_start')
collectionAquaNext = ee.ImageCollection("MODIS/006/MYD11A2")\
.filterDate('2020-06-20', '2020-07-10')\
.sort('system:time_start')
BoroughBoundaries = ee.FeatureCollection("users/mbilik0726/borough-boundaries")
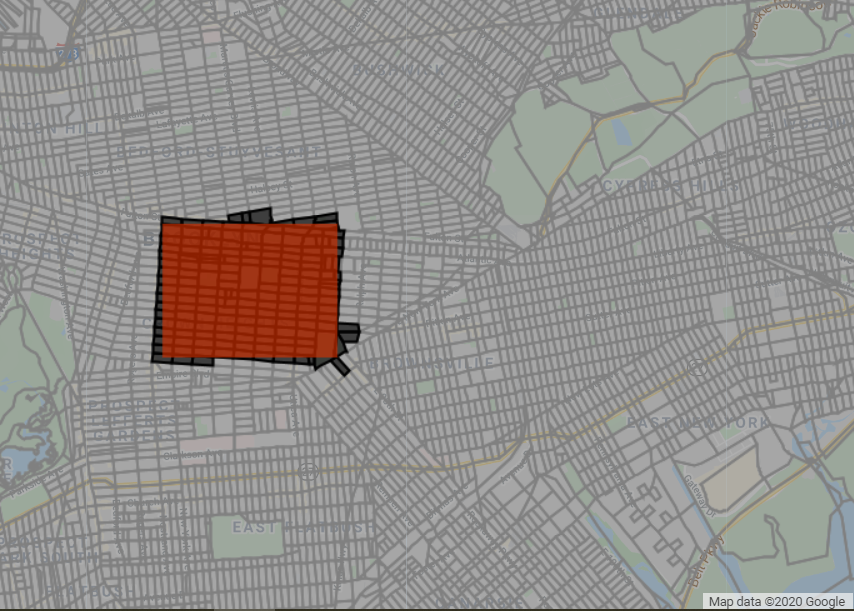
roi = ee.Geometry.Polygon(\
[[[-73.94953700740135, 40.67978549202899],\
[-73.94953700740135, 40.66585457665722],\
[-73.92550441462791, 40.66585457665722],\
[-73.92550441462791, 40.67978549202899]]], None, False)
def clip(image):
return image.clip(BoroughBoundaries)
collectionAqua = collectionAqua.map(clip)
collectionAquaNext = collectionAquaNext.map(clip)
def changeBandName(image):
LST1km = image.select('LST_Day_1km').multiply(.02).subtract(273.15)
LST = LST1km.rename('LST')
return image.addBands(LST)
collectionAqua = collectionAqua.map(changeBandName)
collectionAquaNext = collectionAquaNext.map(changeBandName)
print('Size of MODIS Aqua collection', collectionAqua.size().getInfo());
blocks = ee.FeatureCollection('TIGER/2010/Blocks')
subset = blocks.filterBounds(roi);
print('Size of Census blocks subset', subset.size().getInfo());
#/********************************** GET TRIPLETS ***********************************/
def getTriplets(collection):
  triplets = collection.map(lambda image:
    image.select('LST').reduceRegions(\
      collection=subset.select(['blockid10']), \
      reducer=ee.Reducer.mean(), \
      scale=30\
    ).filter(ee.Filter.neq('mean', None))\
      .map(lambda f: f.set('imageId', image.id()))\
  ).flatten()

  return triplets

def getTripletsOverSeveralCollections(collections):
  tripletsArr = []
  for eachCollection in collections:
    triplets = getTriplets(eachCollection)
    tripletsArr.append(triplets.getInfo())

  return tripletsArr

triplets = getTriplets(collectionAqua)
#/********************************** FORMAT ***********************************/

def format(table, rowId, colId):
  rows = table.distinct(rowId)

  joined = ee.Join.saveAll('matches').apply(
    primary=rows,
    secondary=table,
    condition=ee.Filter.equals(
      leftField=rowId,
      rightField=rowId
    )
  )
  return joined.map(lambda row:
    row.select([rowId]).set(ee.Dictionary(ee.List(row.get('matches')).map(lambda feature: (ee.Feature(feature).get(colId), ee.Feature(feature).get('mean'))).flatten()))
  )
#/********************************** GET TABLES ***********************************/
table1 = format(triplets, 'imageId', 'blockid10')
print(table1.first().getInfo())
# Several collections
collections = [collectionAqua, collectionAquaNext]
tripletsAll = getTripletsOverSeveralCollections(collections)
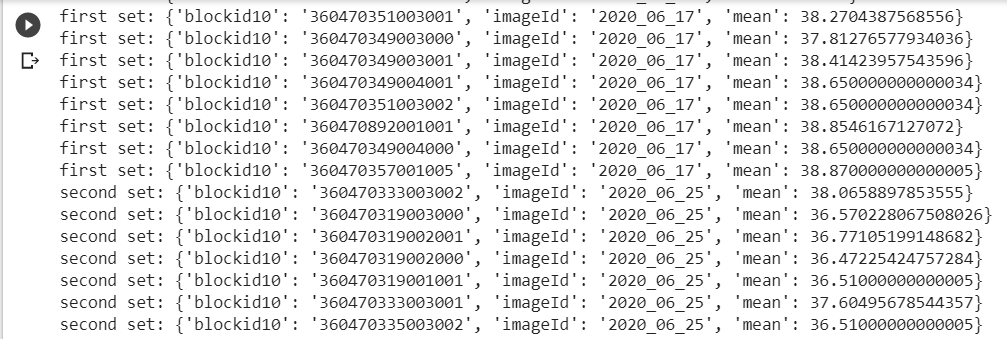
for eachItem in tripletsAll[0]['features']:
print(f"first set: {eachItem['properties']}")
for eachItem in tripletsAll[1]['features']:
print(f"second set: {eachItem['properties']}")
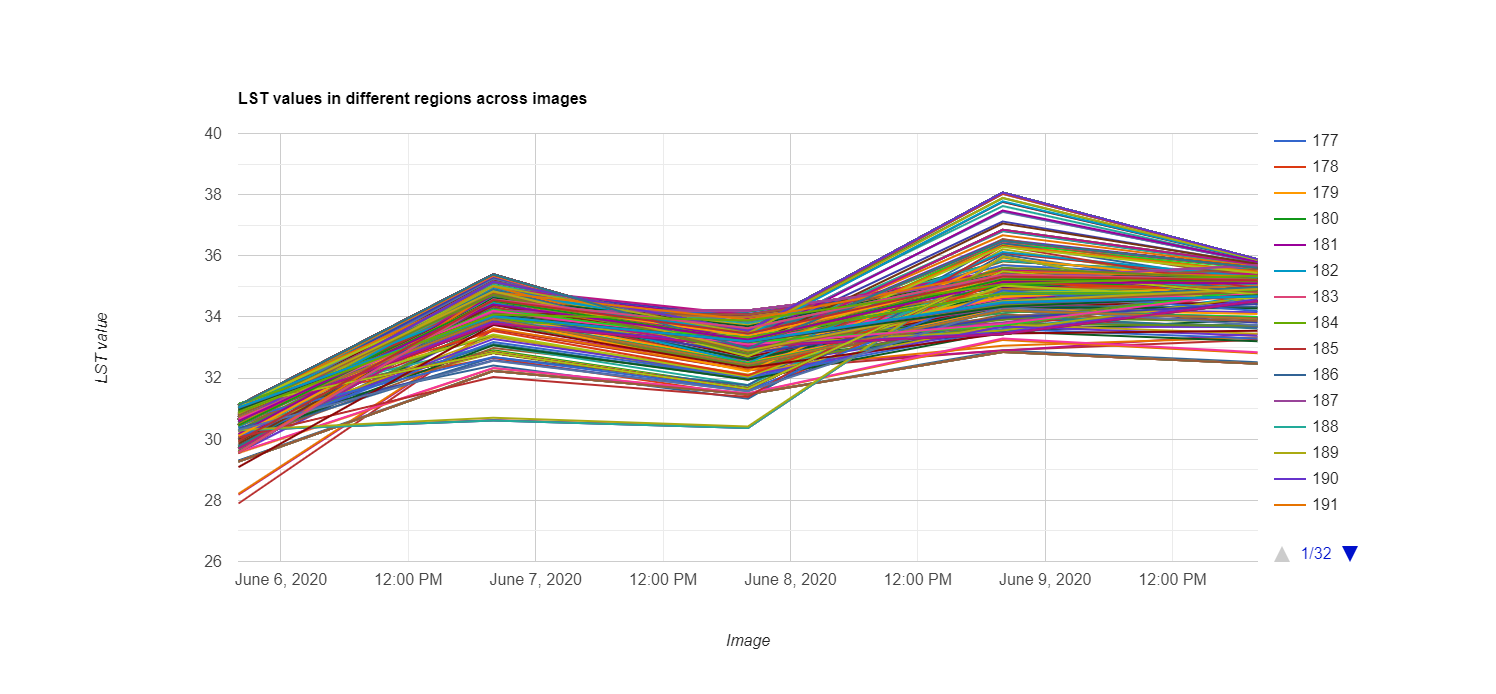
Plotting